
Testing and Targets
Test targets are designed to help evaluate or calibrate the performance (imaging quality) of an imaging system. This could include troubleshooting a system; benchmarking, certifying, or evaluating measurements; or establishing a foundation to ensure multiple systems work well with one another. Because image quality can be defined by different components, particularly resolution, contrast, Modulation Transfer Function (MTF), Depth of Field (DOF), or distortion, different systems may require different targets, and some systems may require more than one.
It is important to keep in mind that the results of using a test target are subjective if only viewed visually; using visual observation is dependent on who is looking at the target. For instance, someone with 20/20 vision is typically capable of discerning higher resolution or more detail than someone with 20/25 or 20/30 vision. Additionally, individuals that regularly look at these targets can have their brains trained to see detail that may not actually exist due to viewing the target’s repetitive frequencies or patterns. While visual inspection can help compare two different systems, it does not always validate results. If possible, it is important to use software to truly validate measurements.
Targets for Resolution Measurements | |||
Target | Applications | Pros | Cons |
USAF 1951 | Test resolution in vision systems, optical test equipment, microscopes, high magnification video lenses, fluorescence and confocal microscopy, photolithography, and nanotechnology | Simultaneously test the vertical and horizontal resolutions at discrete spatial frequencies | Must reposition target to fully evaluate a system’s performance |
Can be difficult to determine when the entire FOV is in best focus | |||
Ronchi Ruling | Testing resolution and contrast | Can simultaneously determine system’s best focus across entire FOV | Different target required for each frequency that needs to be evaluated |
Diffraction testing | Non-symmetrical resolution reductions cannot be analyzed | ||
Star | Comparing highly resolved or magnified imaging systems | Potentially most powerful for testing resolution and contrast | Difficult to determine exact resolution that the test system is achieving at each element |
System alignment | Can evaluate continuous change in resolution across multiple orientations without repositioning target | ||
Assembly assistance | Eases the comparison of different imaging systems | Requires advanced image analysis software | |
Table 1: Applications, Pros, and Cons of Resolution Targets.
The USAF 1951 Target
One of the most commonly used test targets is the USAF 1951 target, which is comprised of sets of horizontal and vertical lines, called elements, of varying sizes (Figure 1). The horizontal and vertical elements are used by a system to simultaneously test the vertical and horizontal resolutions at discrete spatial frequencies (line pairs per millimeter, or lp/mm) in the object plane. Each element has a unique set of widths and spacings and is identified with a number from 1 to 6. Together, six sequentially numbered elements are considered a group, and each group has an identifying number that can be positive, negative, or zero. Typically, this number ranges from -2 to 7. The group number and element number are then used together to determine spatial frequency. The resolution is based on bar width and space, where the length of the bars is equal to five times the width of a bar (Figure 2). One line pair (lp) is equivalent to one black bar and one white bar. Vertical bars are used to calculate horizontal resolution, and horizontal bars are used to calculate vertical resolution.
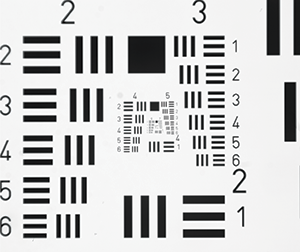
Figure 1: Example of a USAF 1951 Target.
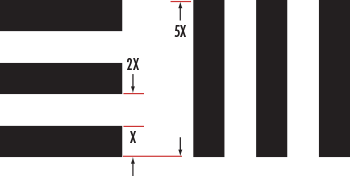
Figure 2: USAF 1951 Target Specifications.
Qualitatively, the resolution of an imaging system is defined as the group and element combination that is located directly before the black and white bars begin to blur together. Quantitatively, resolution (in terms of lp/mm) can be calculated by Equation 1.
USAF 1951 targets are designed so that the elements increase in frequency along a spiral towards the target’s center; higher resolution elements are placed in the middle of the target. This arrangement is beneficial when testing zoom lenses because it avoids the need to reposition the target by allowing the higher resolution elements to remain in the FOV as the lens magnification causes the FOV to decrease.
Limitations of USAF 1951 Targets
USAF 1951 targets do have some drawbacks by having the higher resolution elements placed in the center. For instance, lenses produce different levels of resolution from the center as they do the corners of the FOV. In most cases, moving away from the center of the field causes the resolution to drop, making it important to check resolution and contrast levels at a variety of positions. This requires repositioning the target around the field of view and taking additional images to fully evaluate a system’s performance, increasing testing time. This also can cause issues depending on whether the system is only focused in the center of the FOV or across the entire FOV; because of the resolution varying based on location, it can be difficult to determine when the entire FOV is in best focus. Some lenses obtain very high resolution in the center of the FOV, but very low resolution in the corners when the lens and camera system is focused on the center of the image. A slight defocusing of the lens can balance the resolution across the field, although usually to the detriment of the center resolution. This loss of center resolution is not necessarily bad, however, because the lens could very well still meet the demands of the application even when achieving balanced focus (Figure 3).
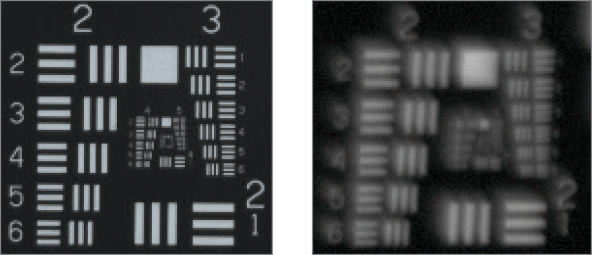
Figure 3a: USAF 1951 Example: The center and corner of an image that has been repositioned so that the best focus is only in the middle of the target.
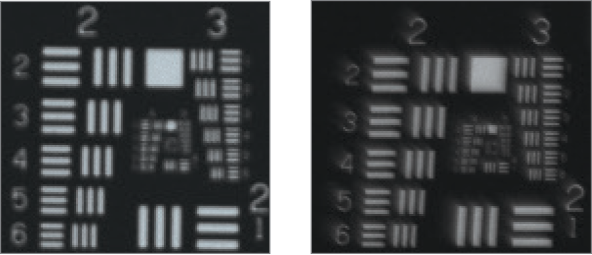
Figure 3b: The center and corner of an image that features balanced focus across the entire field.
The potential for variability in resolution across the field of view reinforces the need to analyze all field positions before drawing conclusions on a system’s performance. The lens that performs optimally with the target at the center may not perform the best overall. However, it is critical to perform all of the analysis at a single focus setting. Although it may seem intuitive to determine the system’s best performance through the middle of the lens and then refocus to see the best performance in the corner, this will not show how the system will perform once deployed since refocusing during operation is often not possible.
There are variations of this target that allow for analysis across the entire FOV by repeating the patterns in numerous locations on the target (Figure 4).
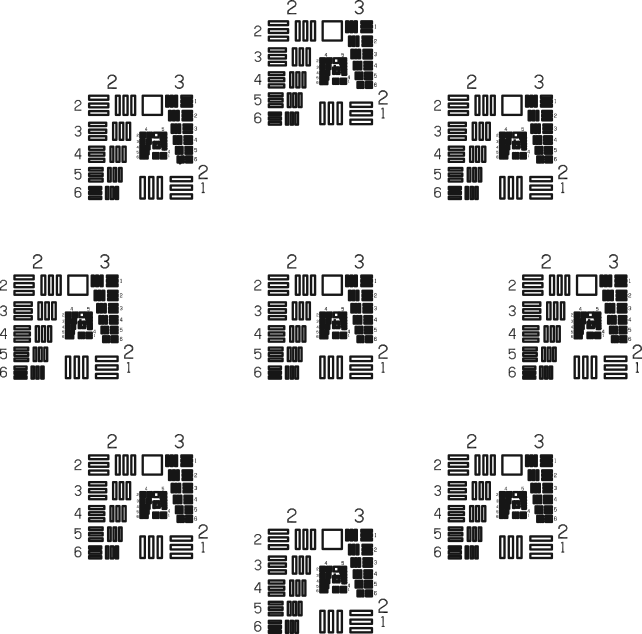
Figure 4a: USAF 1951 Pattern Wheel Target across the entire field.
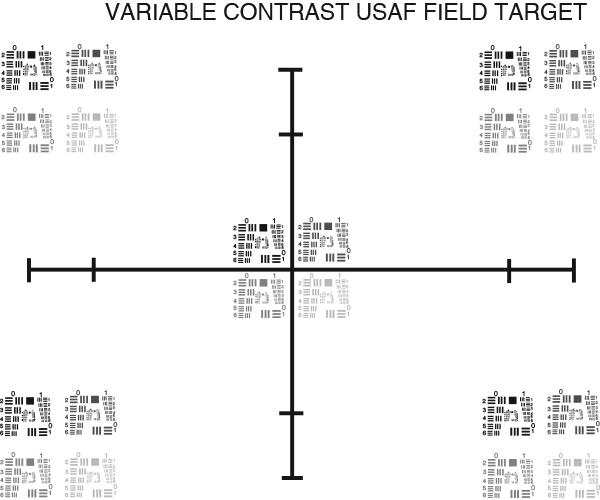
Figure 4b: USAF 1951 Variable Contrast and Field Target.
Ronchi Rulings
Some of the issues associated with the USAF 1951 target can be overcome using a different target known as the Ronchi ruling. This target consists of repeating lines at one spatial frequency, running in one orientation that covers the target’s entire surface (Figure 5). Because there is detail across the entire target, the system’s best focus across the entire field can be determined simultaneously. For applications that need only one frequency to be analyzed, this can be an easy to use, straightforward tool.

Figure 5: Ronchi Ruling.
Limitations of Ronchi Rulings
There are two drawbacks to using the Ronchi ruling. First, since a given target provides only one frequency, a different target is required for each frequency that needs to be evaluated. Second, nonsymmetrical resolution reductions across the field that are the result of factors such as astigmatism cannot be analyzed because the lines only propagate in one direction. To overcome this, the target needs to be rotated by 90? and a second image must be used to analyze the resolution. Additionally, while a lens’ focus can be balanced for best focus, even for cases of astigmatism, it can be difficult to find this balance when flipping a target back and forth.
The Star Target
The multi-element start target, possibly the most powerful for testing the resolution and contrast of a system, combines many of the strengths of both the USAF and Ronchi targets. Each element of the star target consists of a circle formed of alternating positive and negative pie-shaped wedges that are tapered towards the center at a known angle (Figure 6). The element’s tapered wedges provide a continuous change in resolution that can be evaluated in both vertical and horizontal directions, along with a variety of other orientations, without repositioning the target.
Having many stars across the field of view eases the comparison of different imaging solutions by providing the ability to determine the best focus across the FOV while simultaneously analyzing horizontal and vertical information at a variety of resolutions. Figure 7 shows the complete star target; the highlighted areas located in the center, bottom middle, and the corner of the target are compared between two different lenses in the additional example images. For these examples, a Sony ICX625 monochrome sensor with 3.45µm pixels and a total resolution of 5 megapixels and a white light back light illuminator are used.
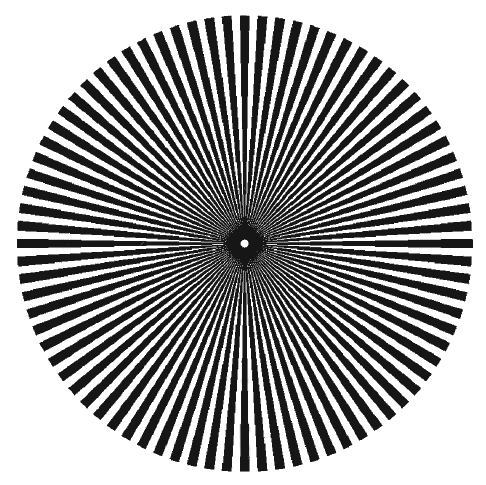
Figure 6: Star Target.

Figure 7: A star target is imaged with two lenses (A and B) with the same focal length, f#, field of view, and sensor. The superiority of lens A becomes apparent along the edge and in the corner of the image.
Limitations of a Star Target
As with other targets, the star target has its drawbacks. Because the wedges provide continuous changes in resolution, it is more difficult to determine the exact resolution that the test system is achieving at each element. While this can be done mathematically, it is not easily done visually. Additionally, the combination of the star elements’ circular nature with the potential for nonsymmetrical blurring make it more difficult to use simple software tools, such as line profilers, to extract information from the image. More advanced image analysis software is required in order to make full use of the star target.
Depth of Field (DOF) Targets
DOF targets enable the visualization and quantification of how well focus is maintained as details move away from the plane that the lens is focused in. DOF targets are fairly straightforward: lines of known frequencies (resolutions) are tipped at a known angle, and are used to determine how well focus is maintained. As the lines proceed closer to and farther away from the lens, the blurrier they become until they are no longer able to be distinguished from one another. Contrast measurement can be made at different distances in order to determine when the desired level of resolution is lost; this determines the DOF limit for a lens at a particular setting. Figures 8 and 9 demonstrate how to use a depth of field target.
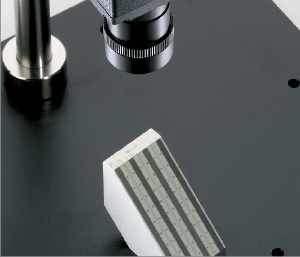
Figure 8: A depth of field target should be at 45° from the lens.
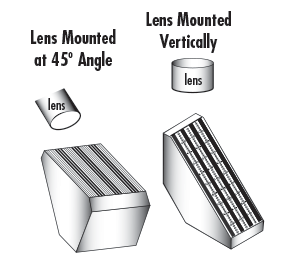
Figure 9: Sample configurations using a depth of field target.
Example: Using a DOF Target
50mm DG Series Lens
Figure 10 shows a vertically mounted camera looking down at a DOF target that has been set at a 45° angle to the imaging path. Since the lens is focused at the middle of the target vertically, the image goes out of focus at the and bottom of the target. The images show three different f/# settings and how adjustments to the iris change the ability to obtain depth of field. Note: Ronchi rulings can also be used to perform this type of testing, as they have fixed frequencies and can be tilted to create this effect; the greater the tip, the more of the DOF that can be measured.
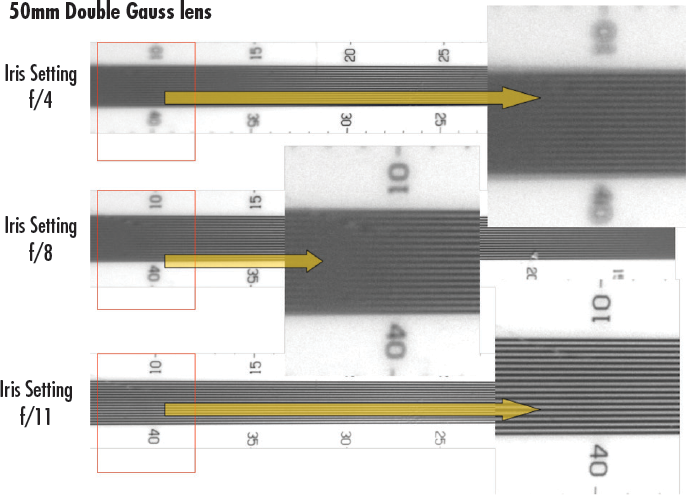
Figure 10: Images of a depth of field target taken with a 50mm lens at f/4, f/8, and f/11.
Distortion Targets
Distortion targets are used to calibrate systems in order to correctly measure the optical misplacement of imaging information. These targets generally consist of dot, grid, or square patterns, are compatible with the calibration routines of most imaging software, and can either remap or adjust measurements across the FOV Figure 11. Figure 12 shows the types of distortion that can be adjusted.
Once the pattern is imaged, the known size and spacing of the pattern allow adjustments to be made (Figure 13).
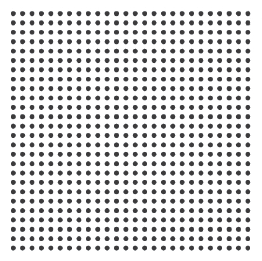
Figure 11: A dot grid distortion target.
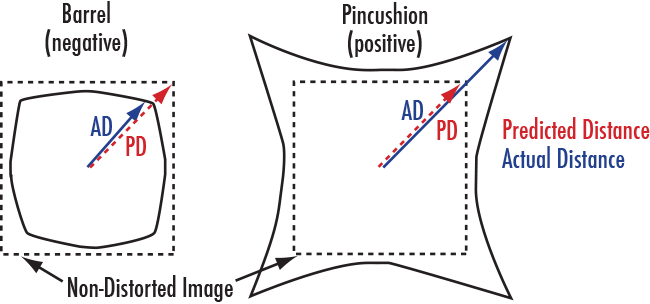
Figure 12: Types of Distortion.
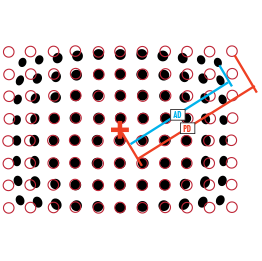
Figure 13: Positional difference can be measured and corrected with software.
版權(quán)所有 © 2026 江陰韻翔光電技術(shù)有限公司 備案號(hào):蘇ICP備16003332號(hào)-1 技術(shù)支持:化工儀器網(wǎng) 管理登陸 GoogleSitemap


